2.2.9 Results - AHP
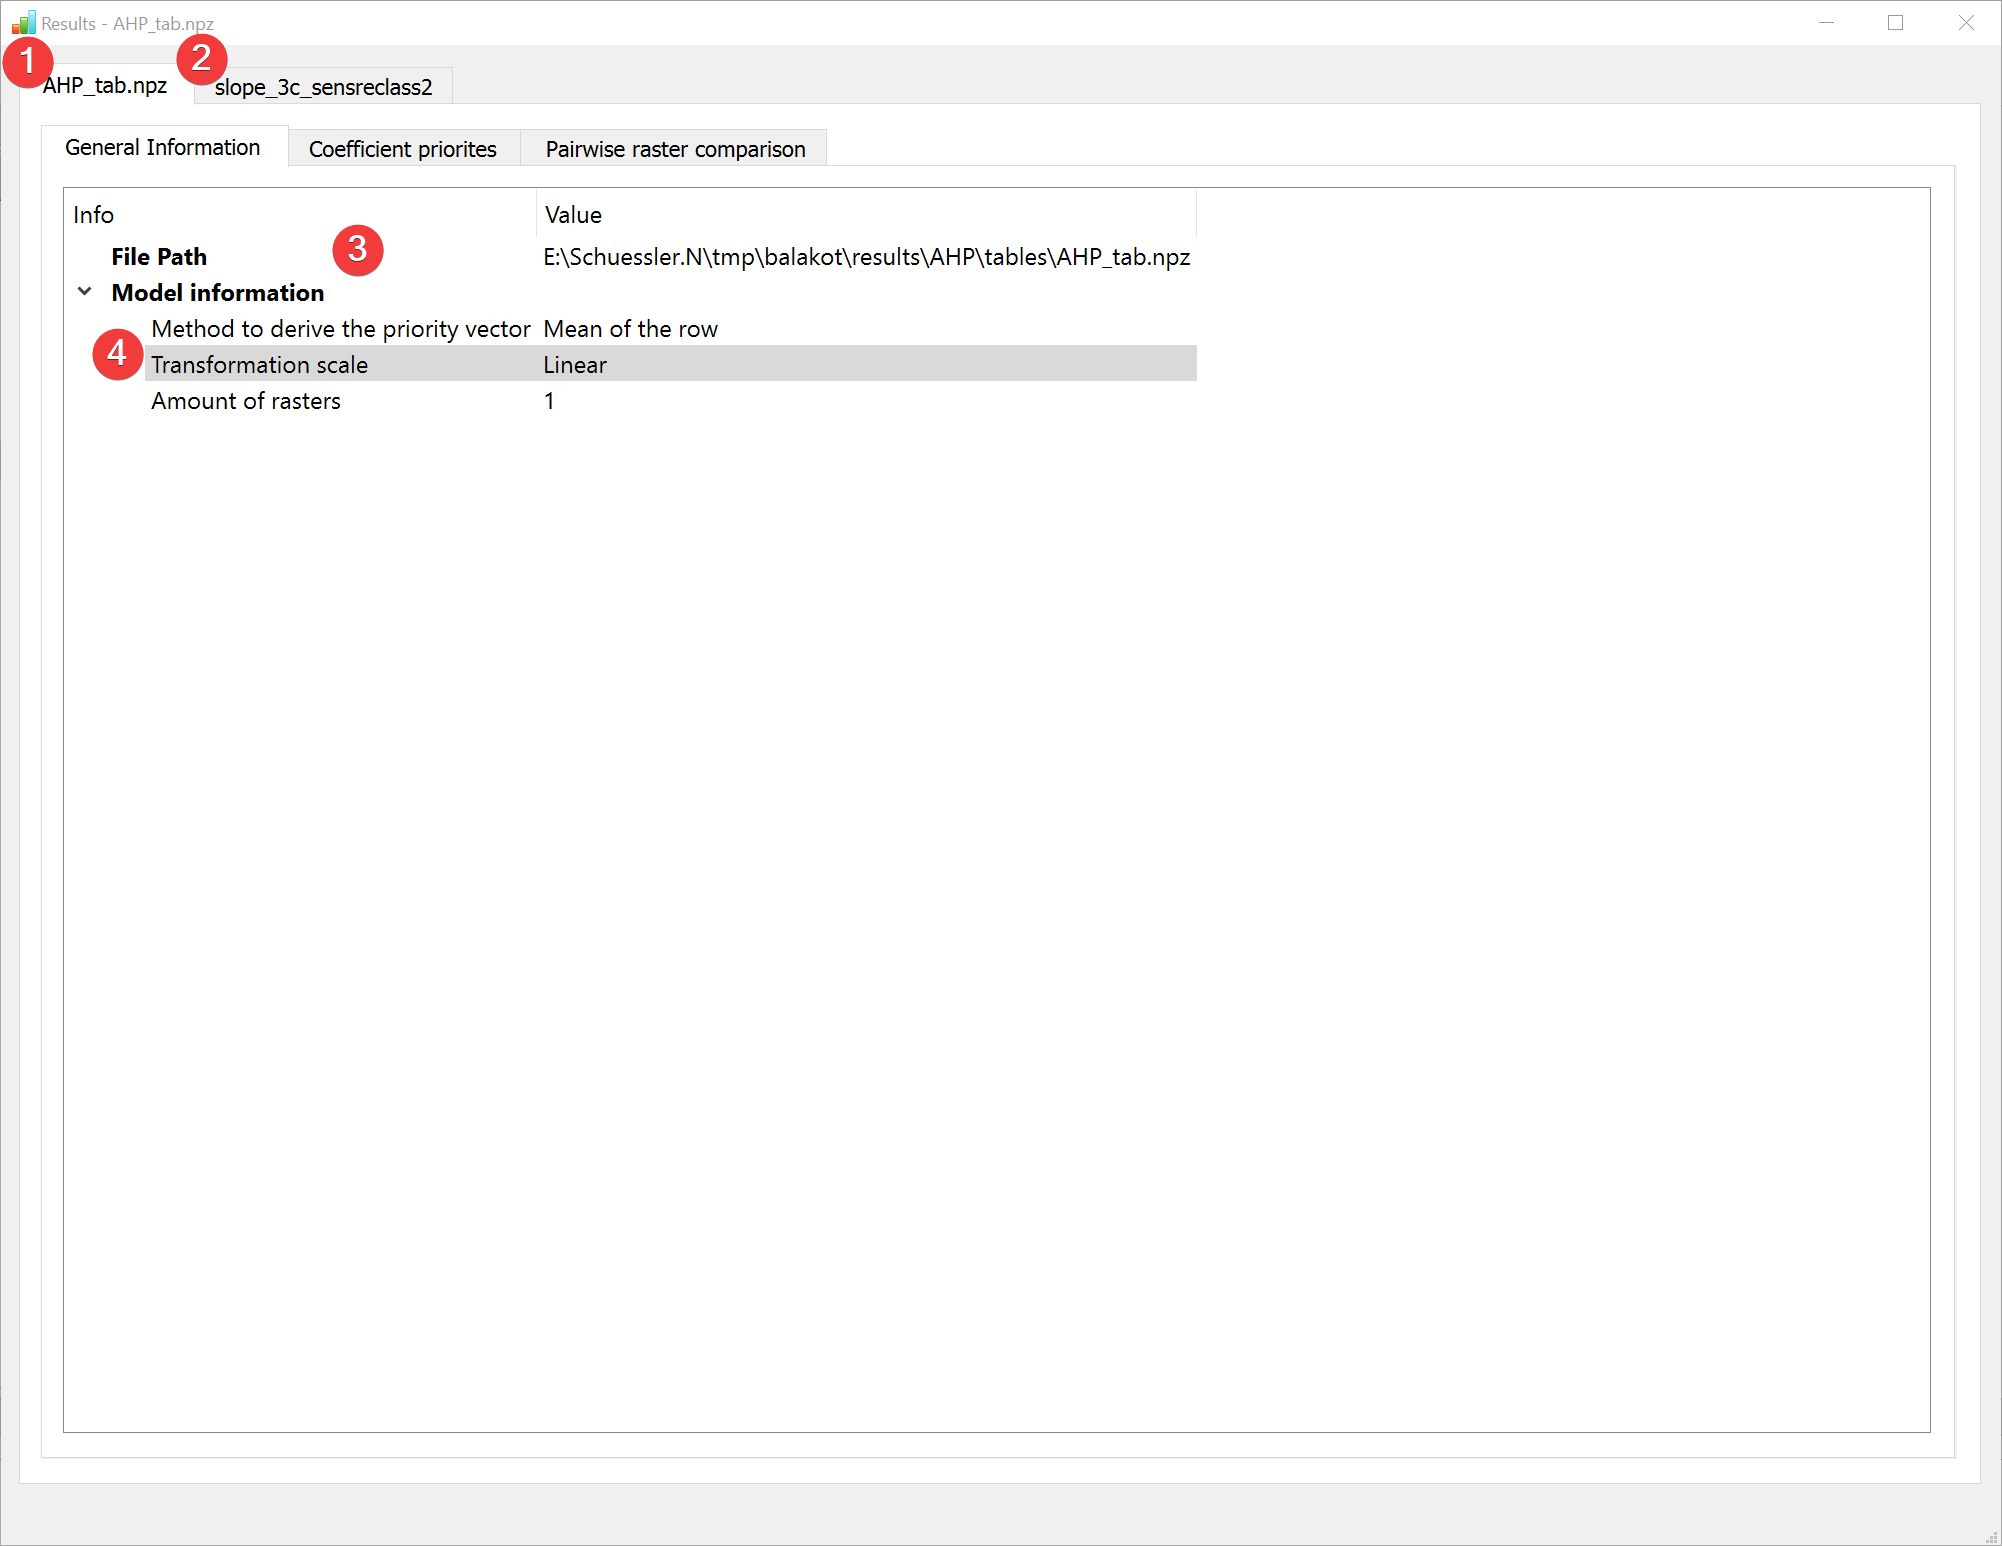
Fig. 2.16 AHP Results Widget - general information raster comparison
Display the results of the Analytic Hierarchy Process (AHP) analysis.
2.2.9.1 Overview
The result viewer shows a tab for the raster comparison (1) and for each raster dataset used in the analysis (2).
The general information tab shows the path to the .npz containing the information (3) and basic information about the model (2).
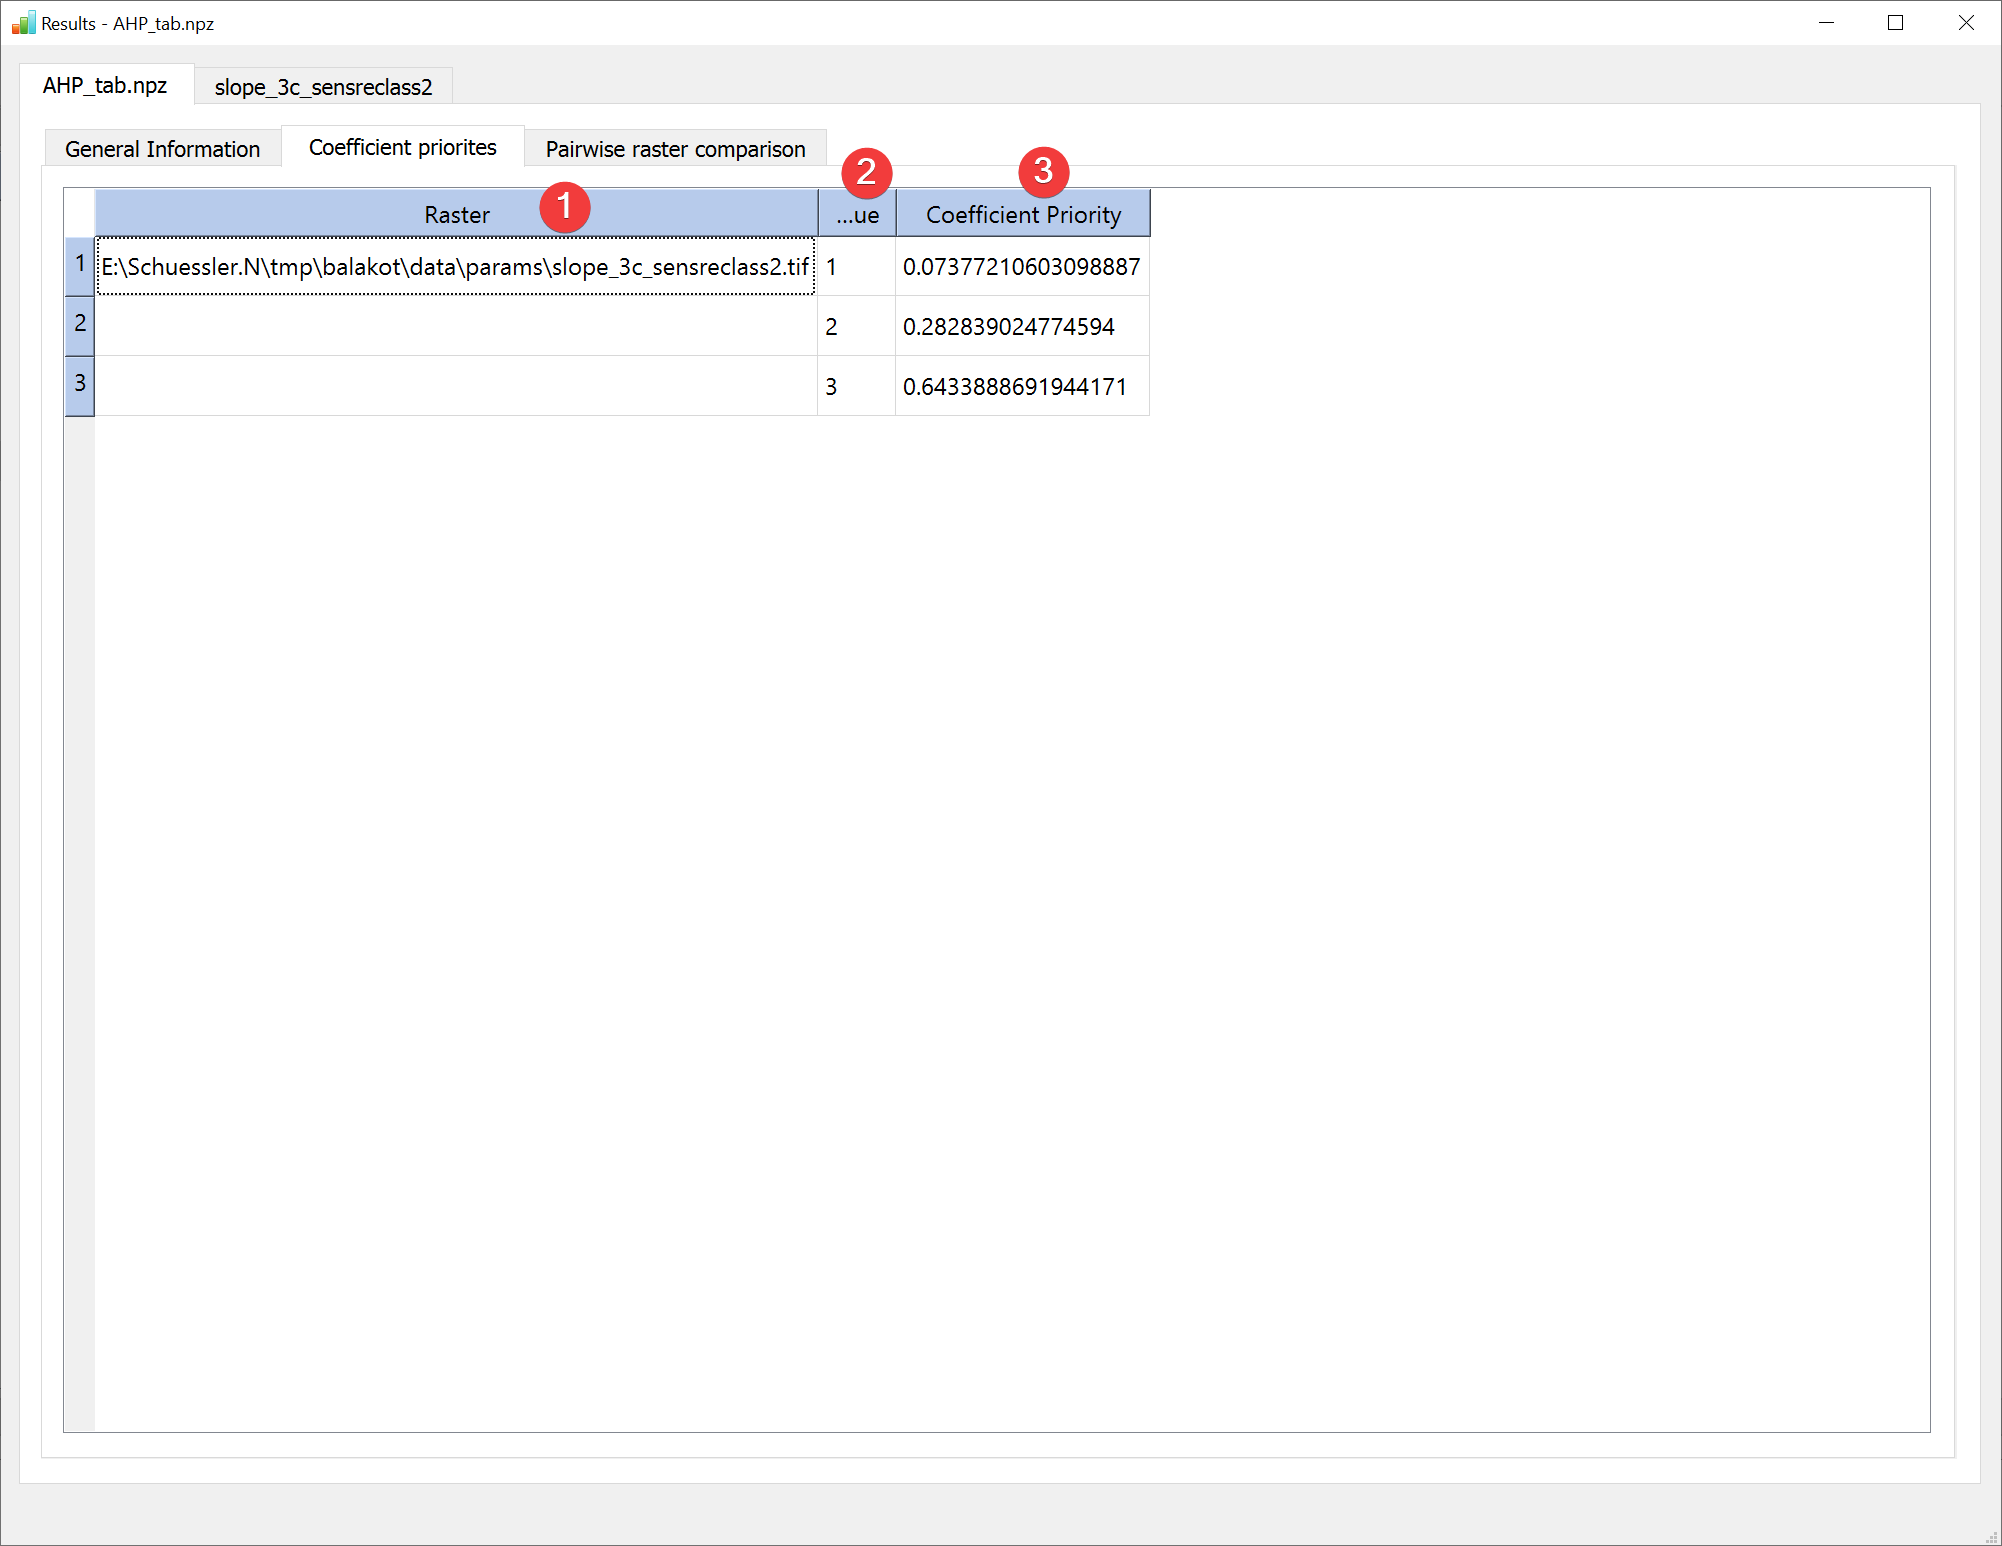
Fig. 2.17 AHP Results Widget - coefficient priorities raster comparison
The coefficient priorities tab contains a table with each raster datasets path (1), its values (2) and the corresponding priorities (3).
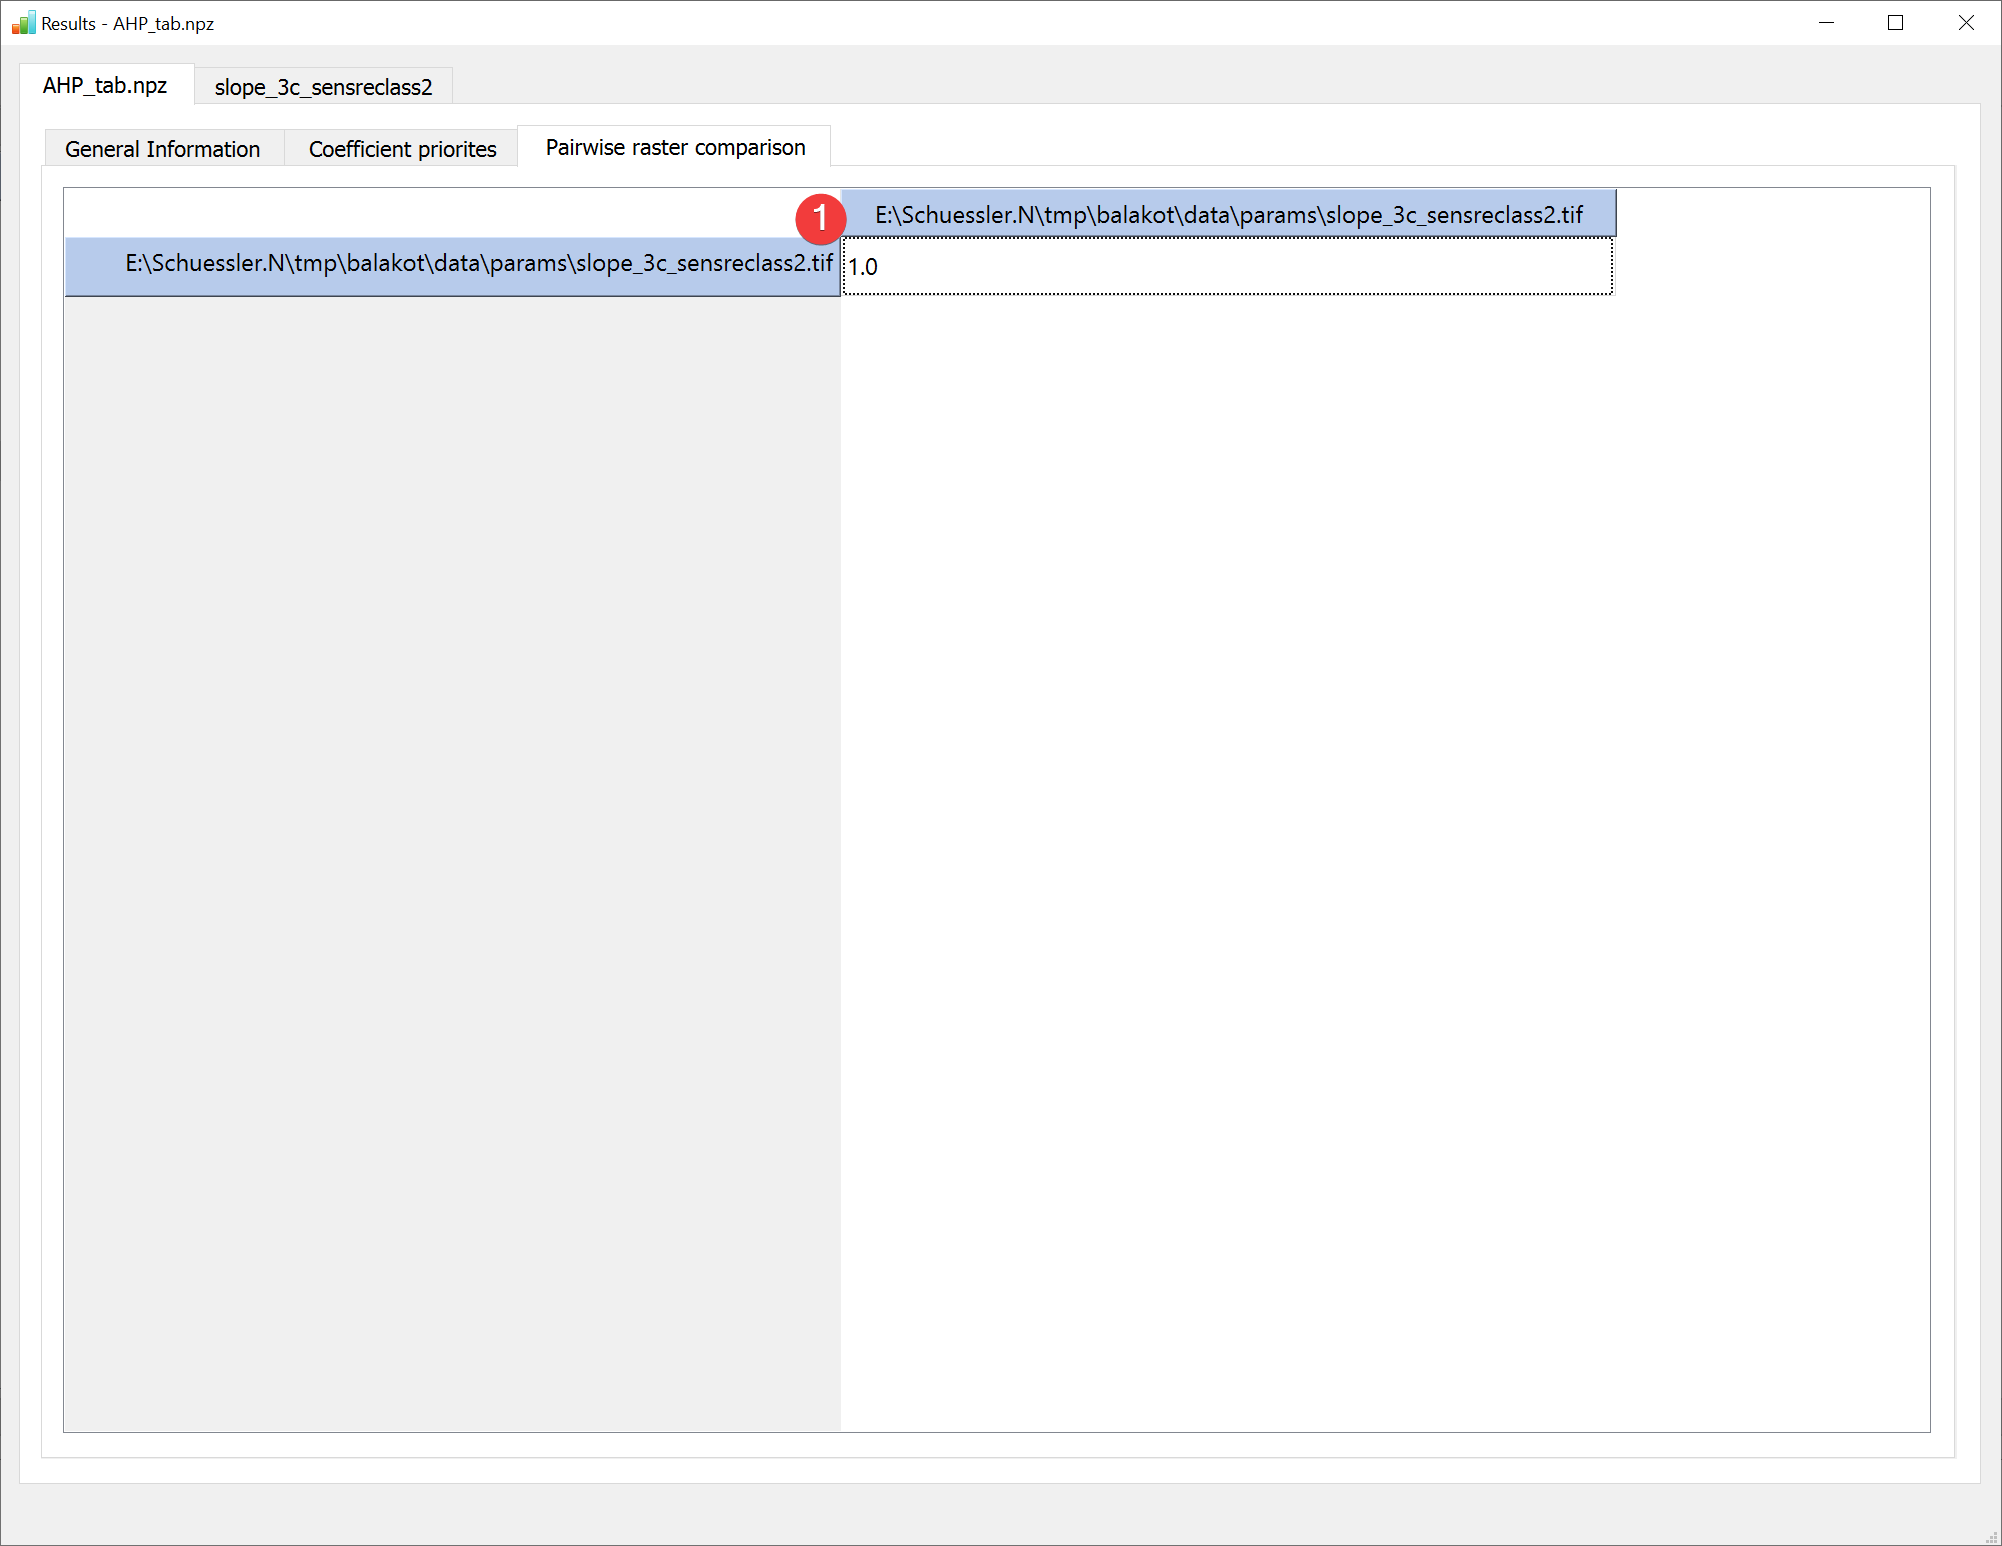
Fig. 2.18 AHP Results Widget - pairwise raster comparison
The pairwise raster comparison tab contains the untransformed pairwise raster comparison table (1).
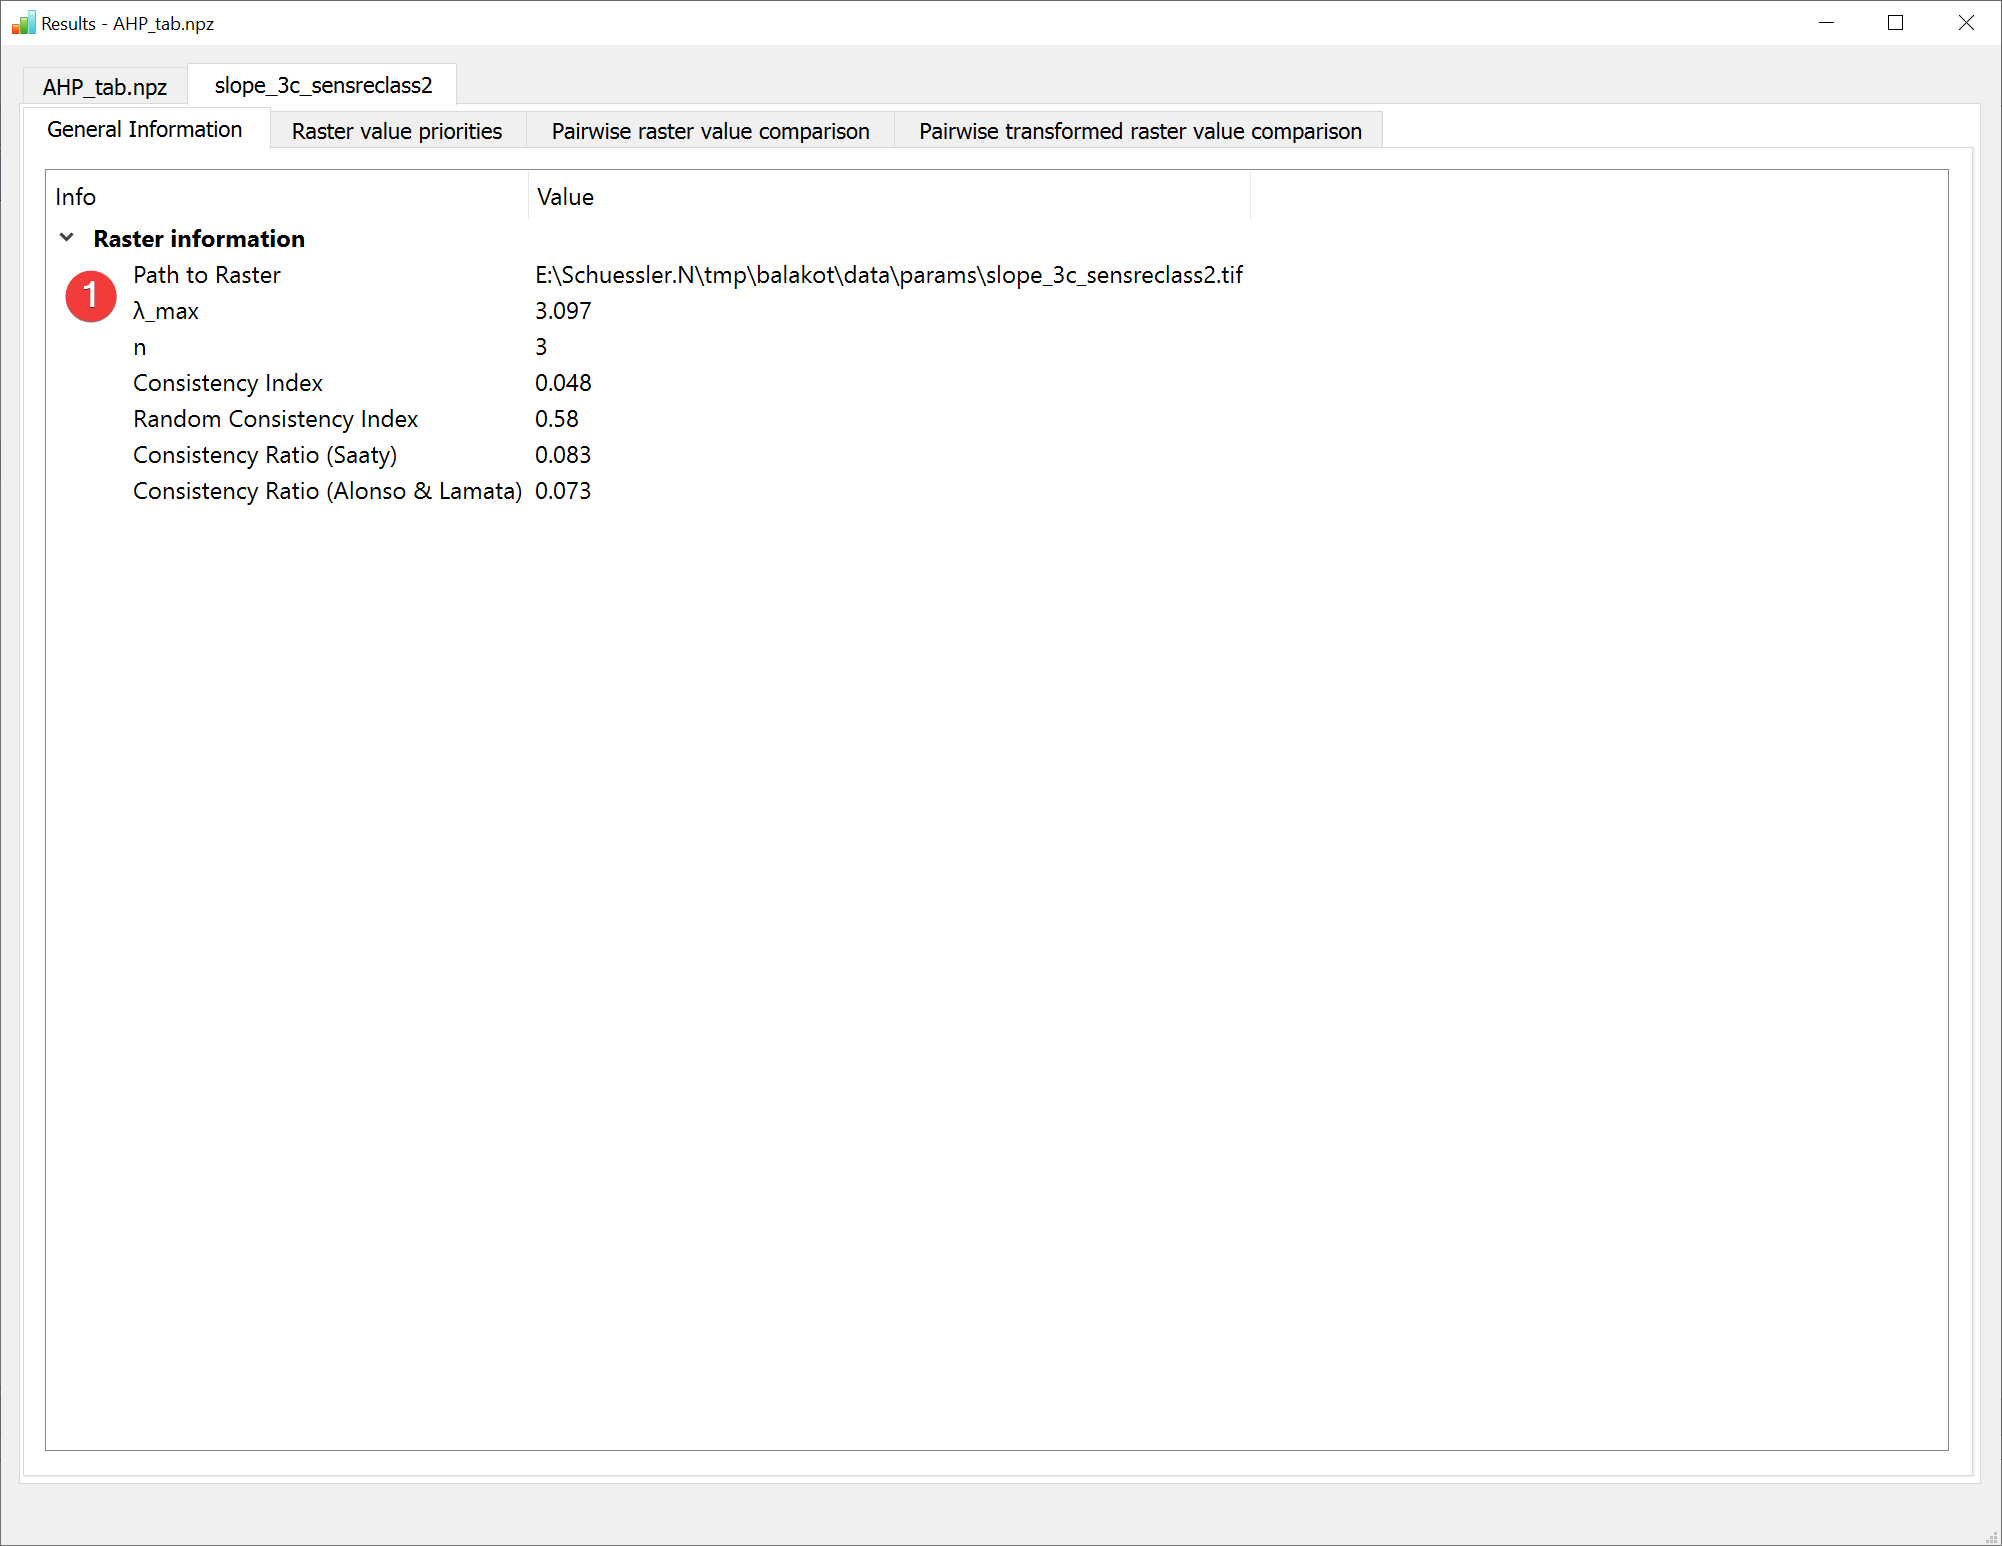
Fig. 2.19 AHP Results Widget - raster dataset general information
The general information tab shows information (1) unique to each raster. To see all available digits hover your mouse over the values.
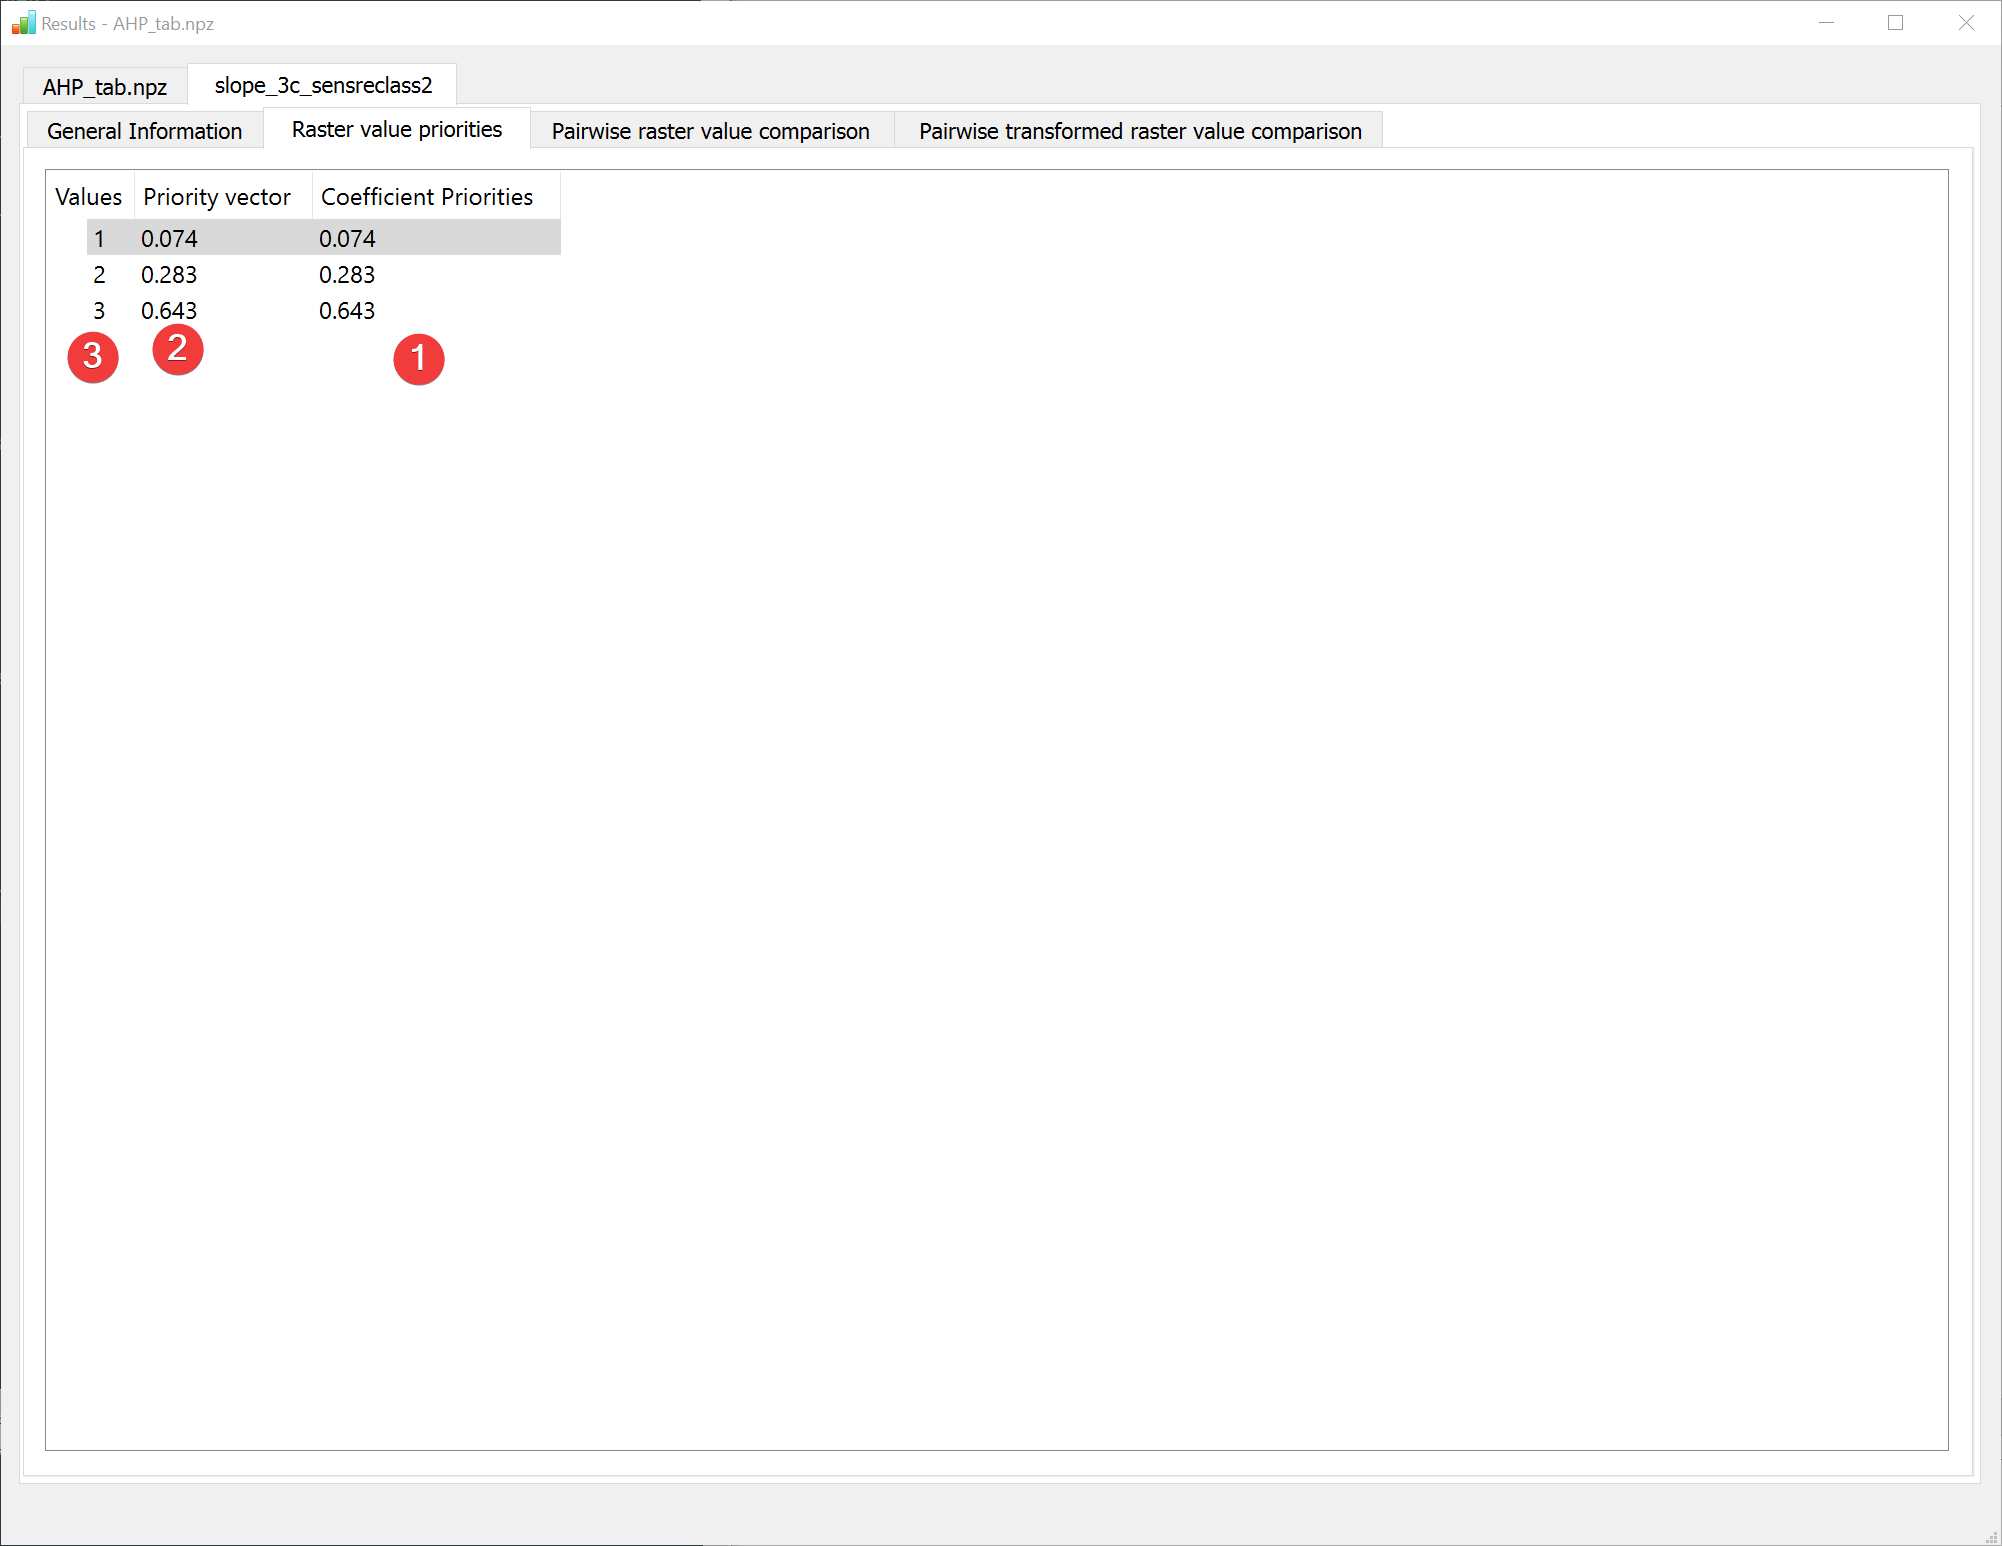
Fig. 2.20 AHP Results Widget - raster value priorities
The raster value priorities tab shows a table of the raster values (1) its priority vectors in the dataset itself (2) and the coefficient priorities (3) when compared with other raster datasets. To see all available digits hover your mouse over the values.
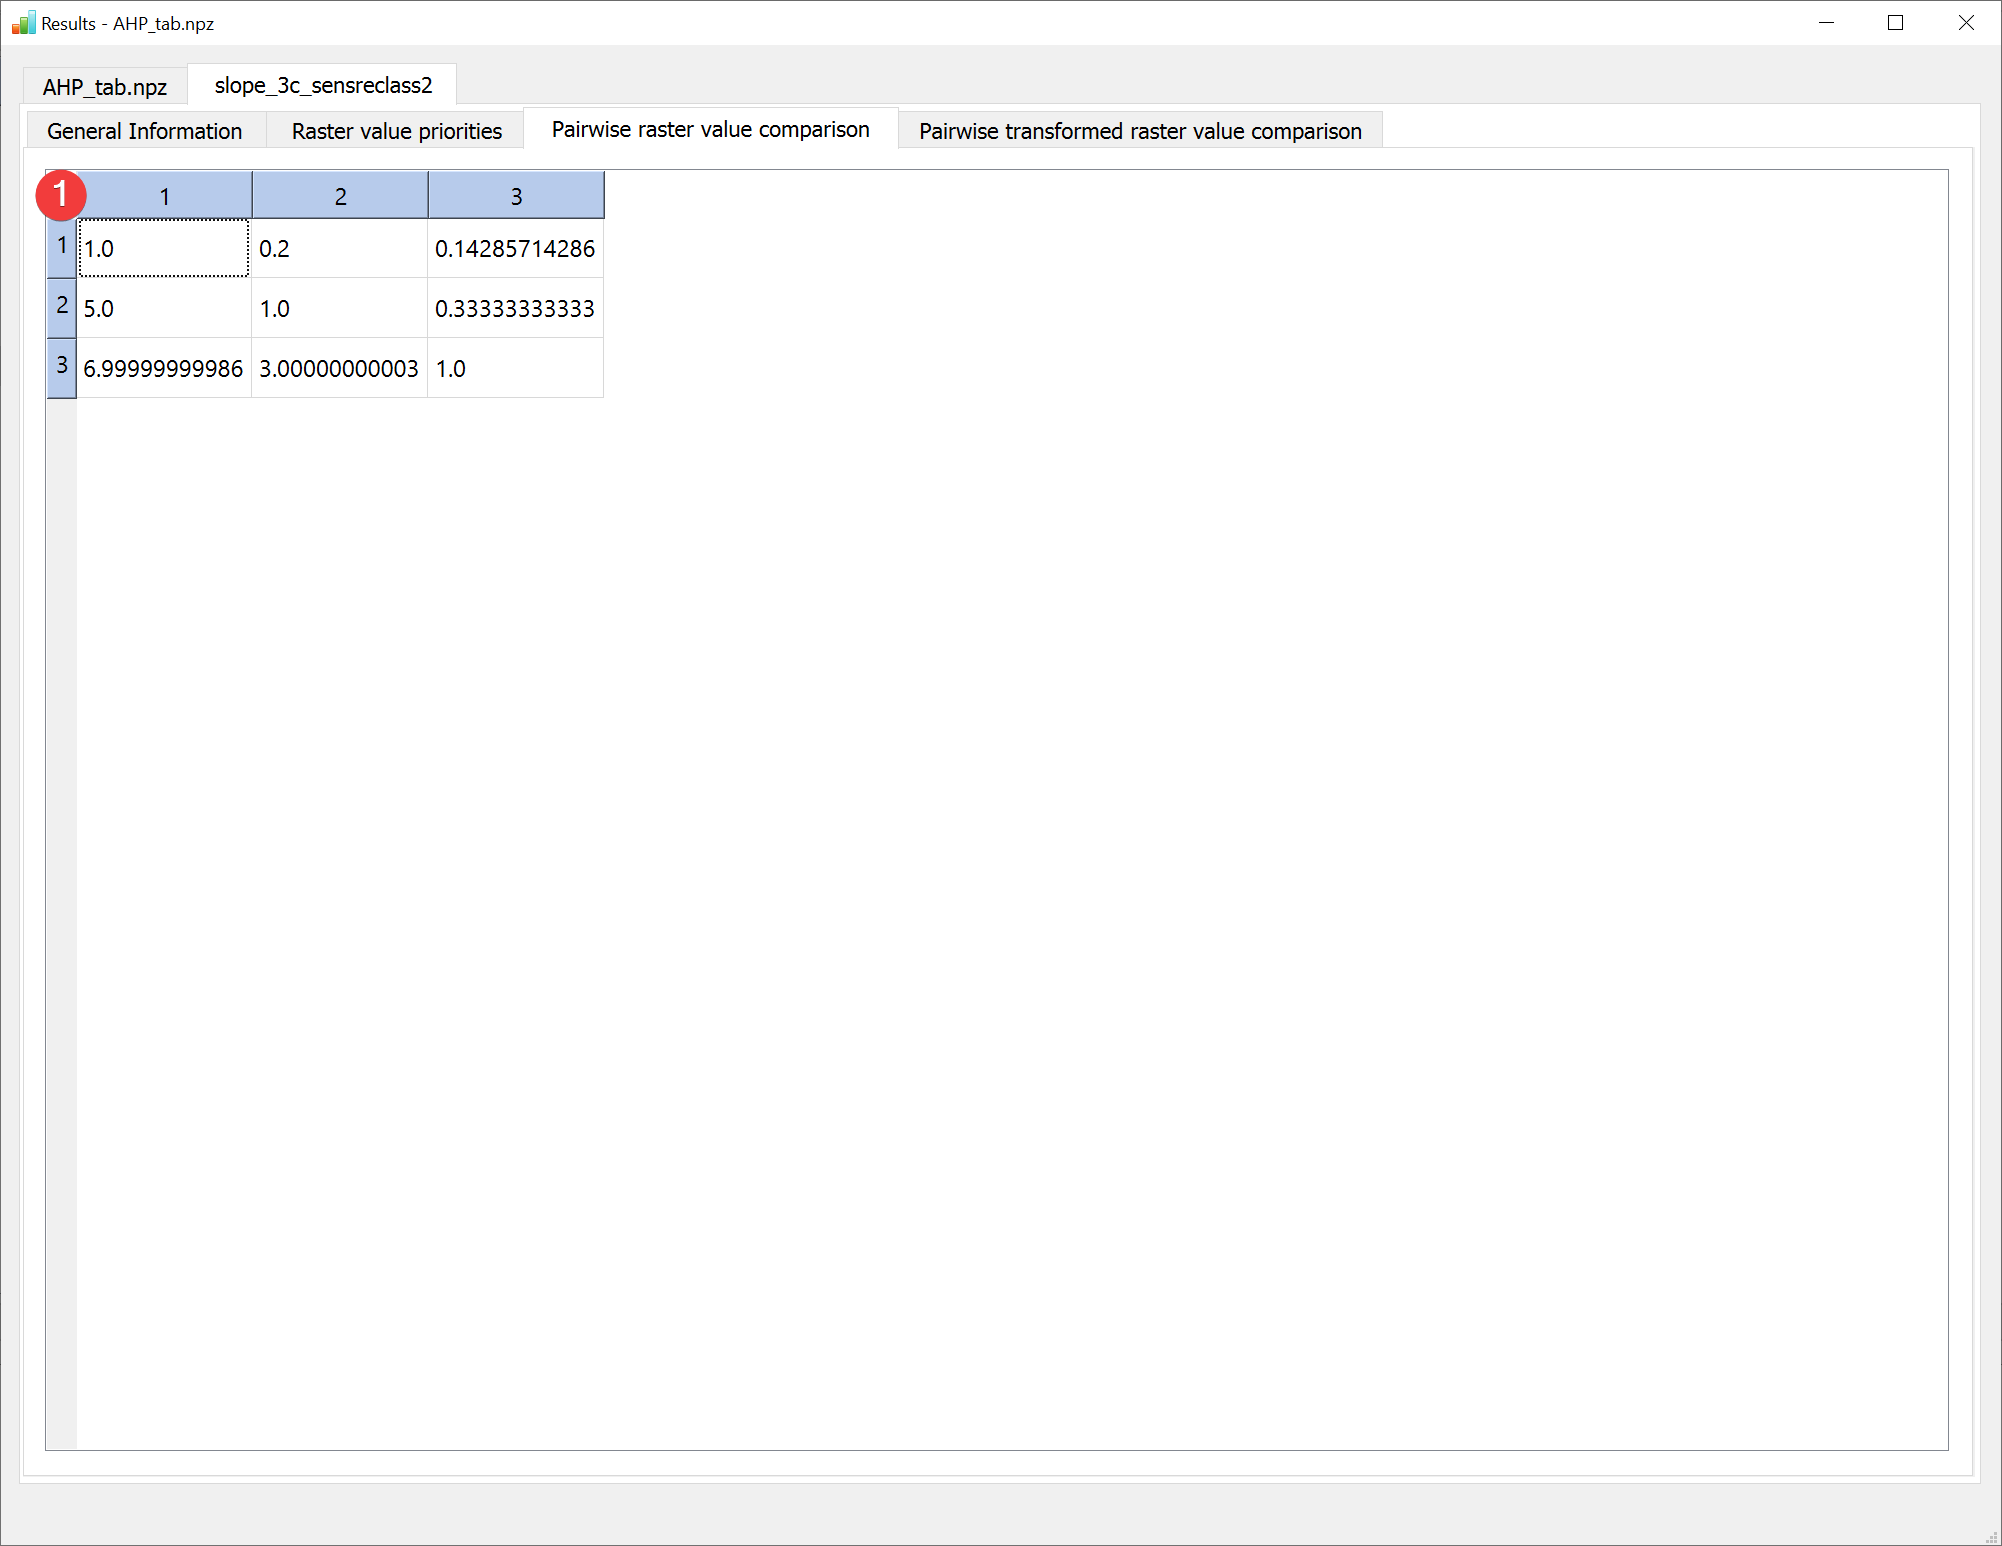
Fig. 2.21 AHP Results Widget - pairwise raster value comparison
The raster value comparison tab shows the raster value comparison table with as defined during the analysis.
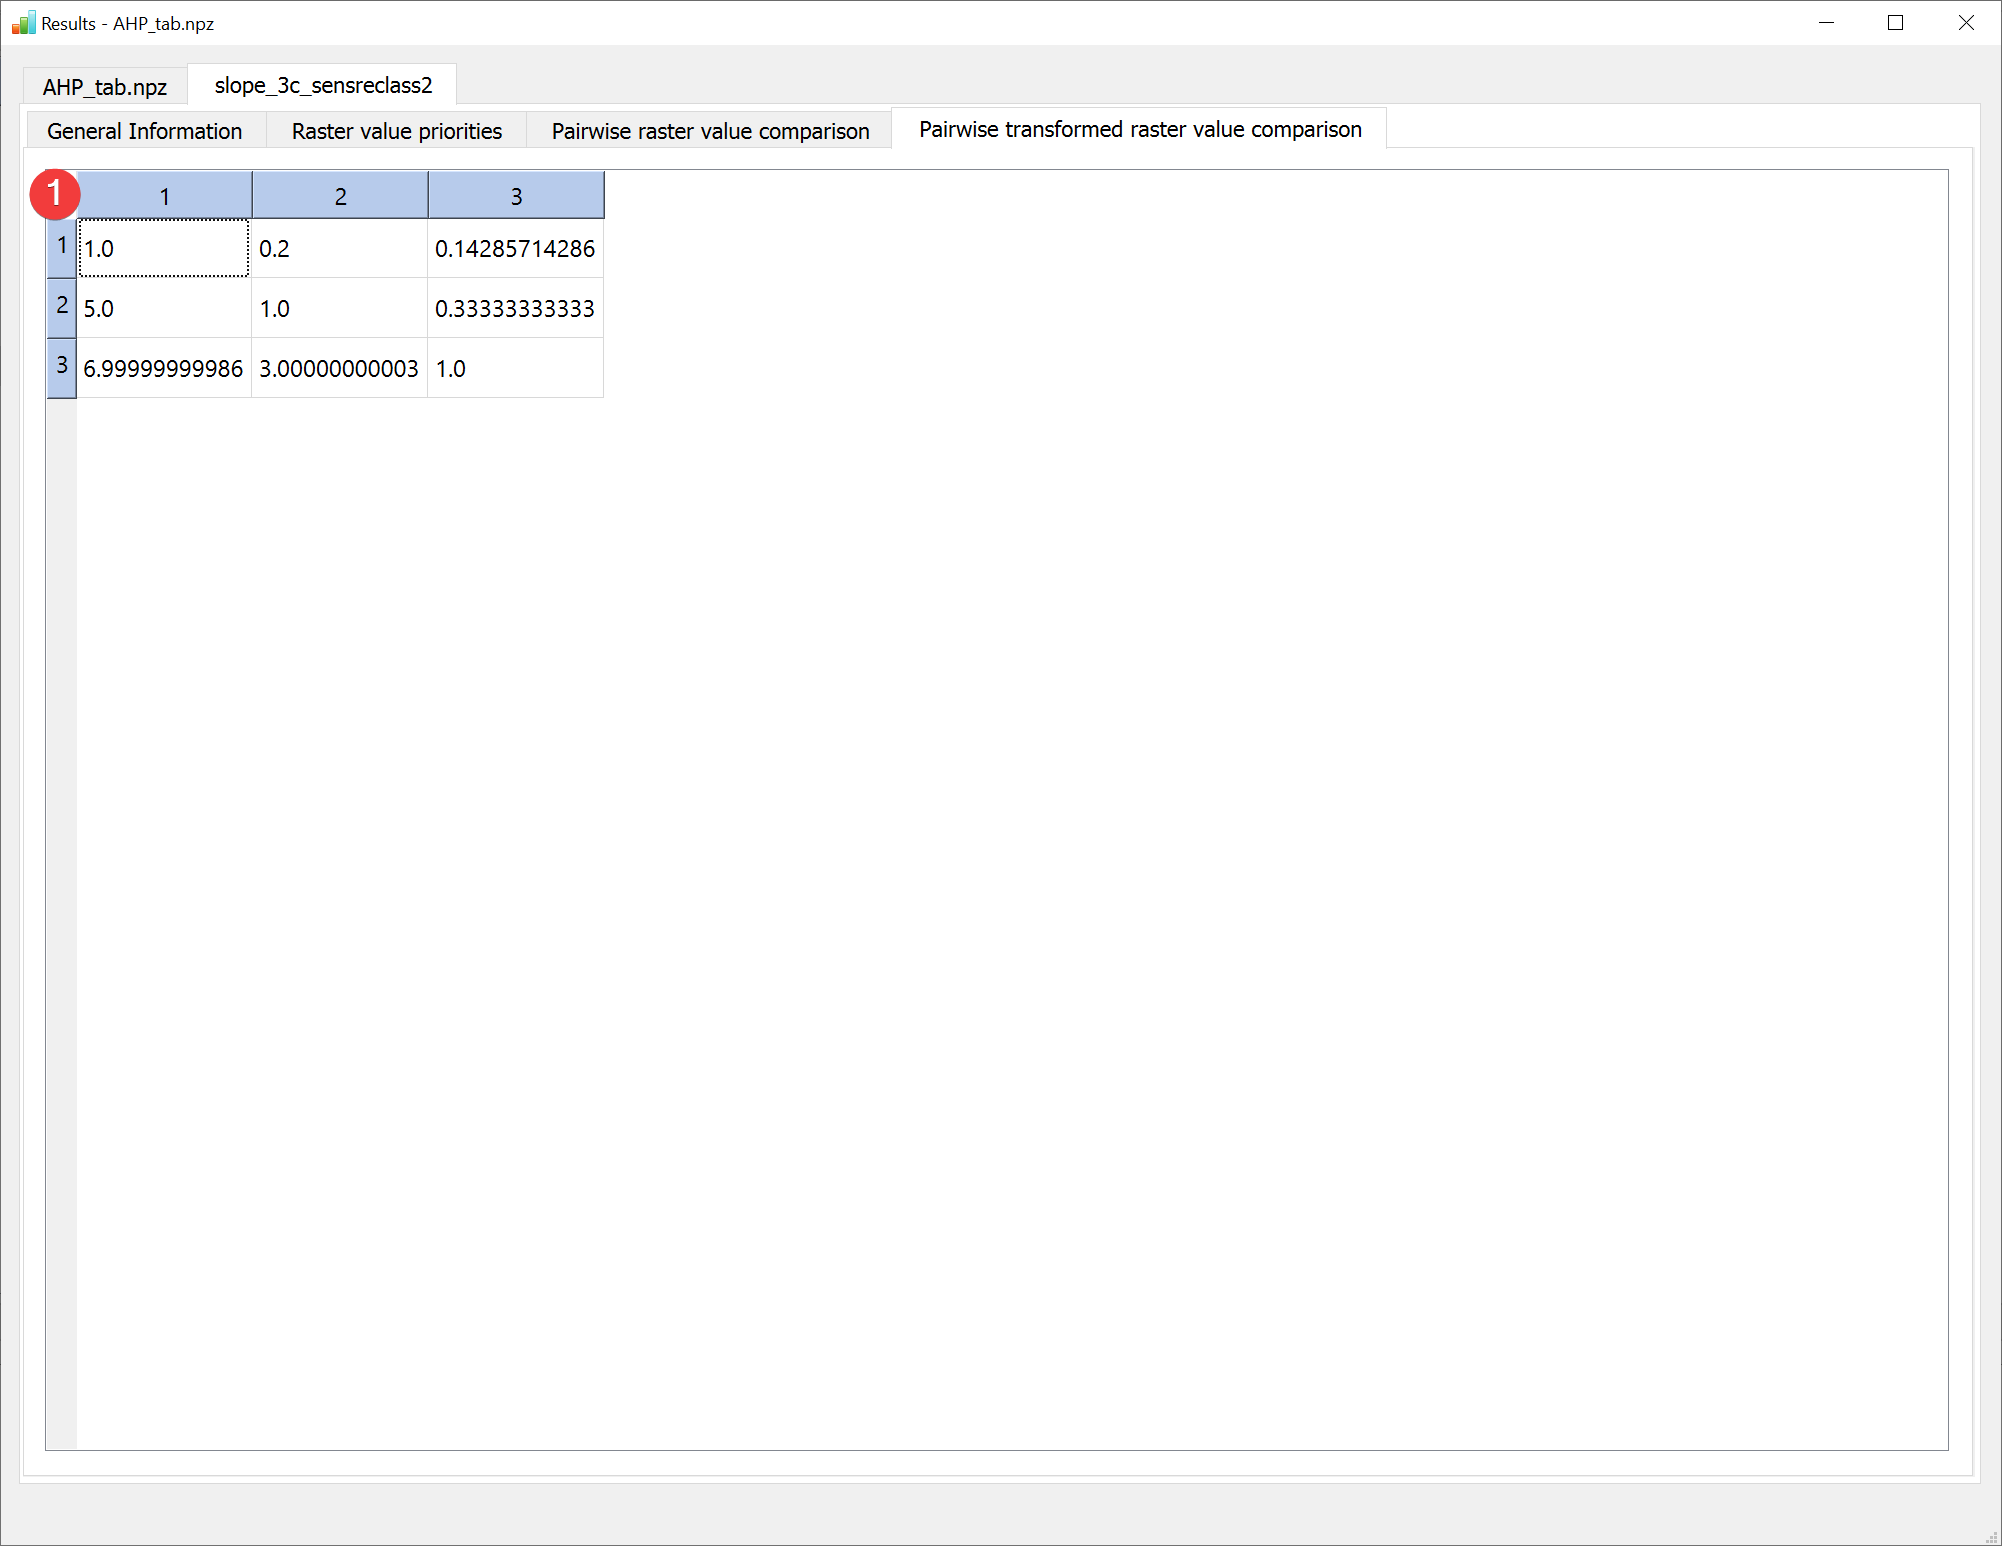
Fig. 2.22 AHP Results Widget - pairwise transformed raster value comparison
The raster value comparison tab shows the raster value comparison table modified by the user defined scale. Because LSAT PM supports only linear transformation at the moment the normal pairwise raster value comparison is the same as the pairwise transformed raster value comparison.
Open this widget by right clicking the output .npz of an Analytic Hierarchy Process (AHP) analysis in the catalog.