2.2.12 Results - WofE
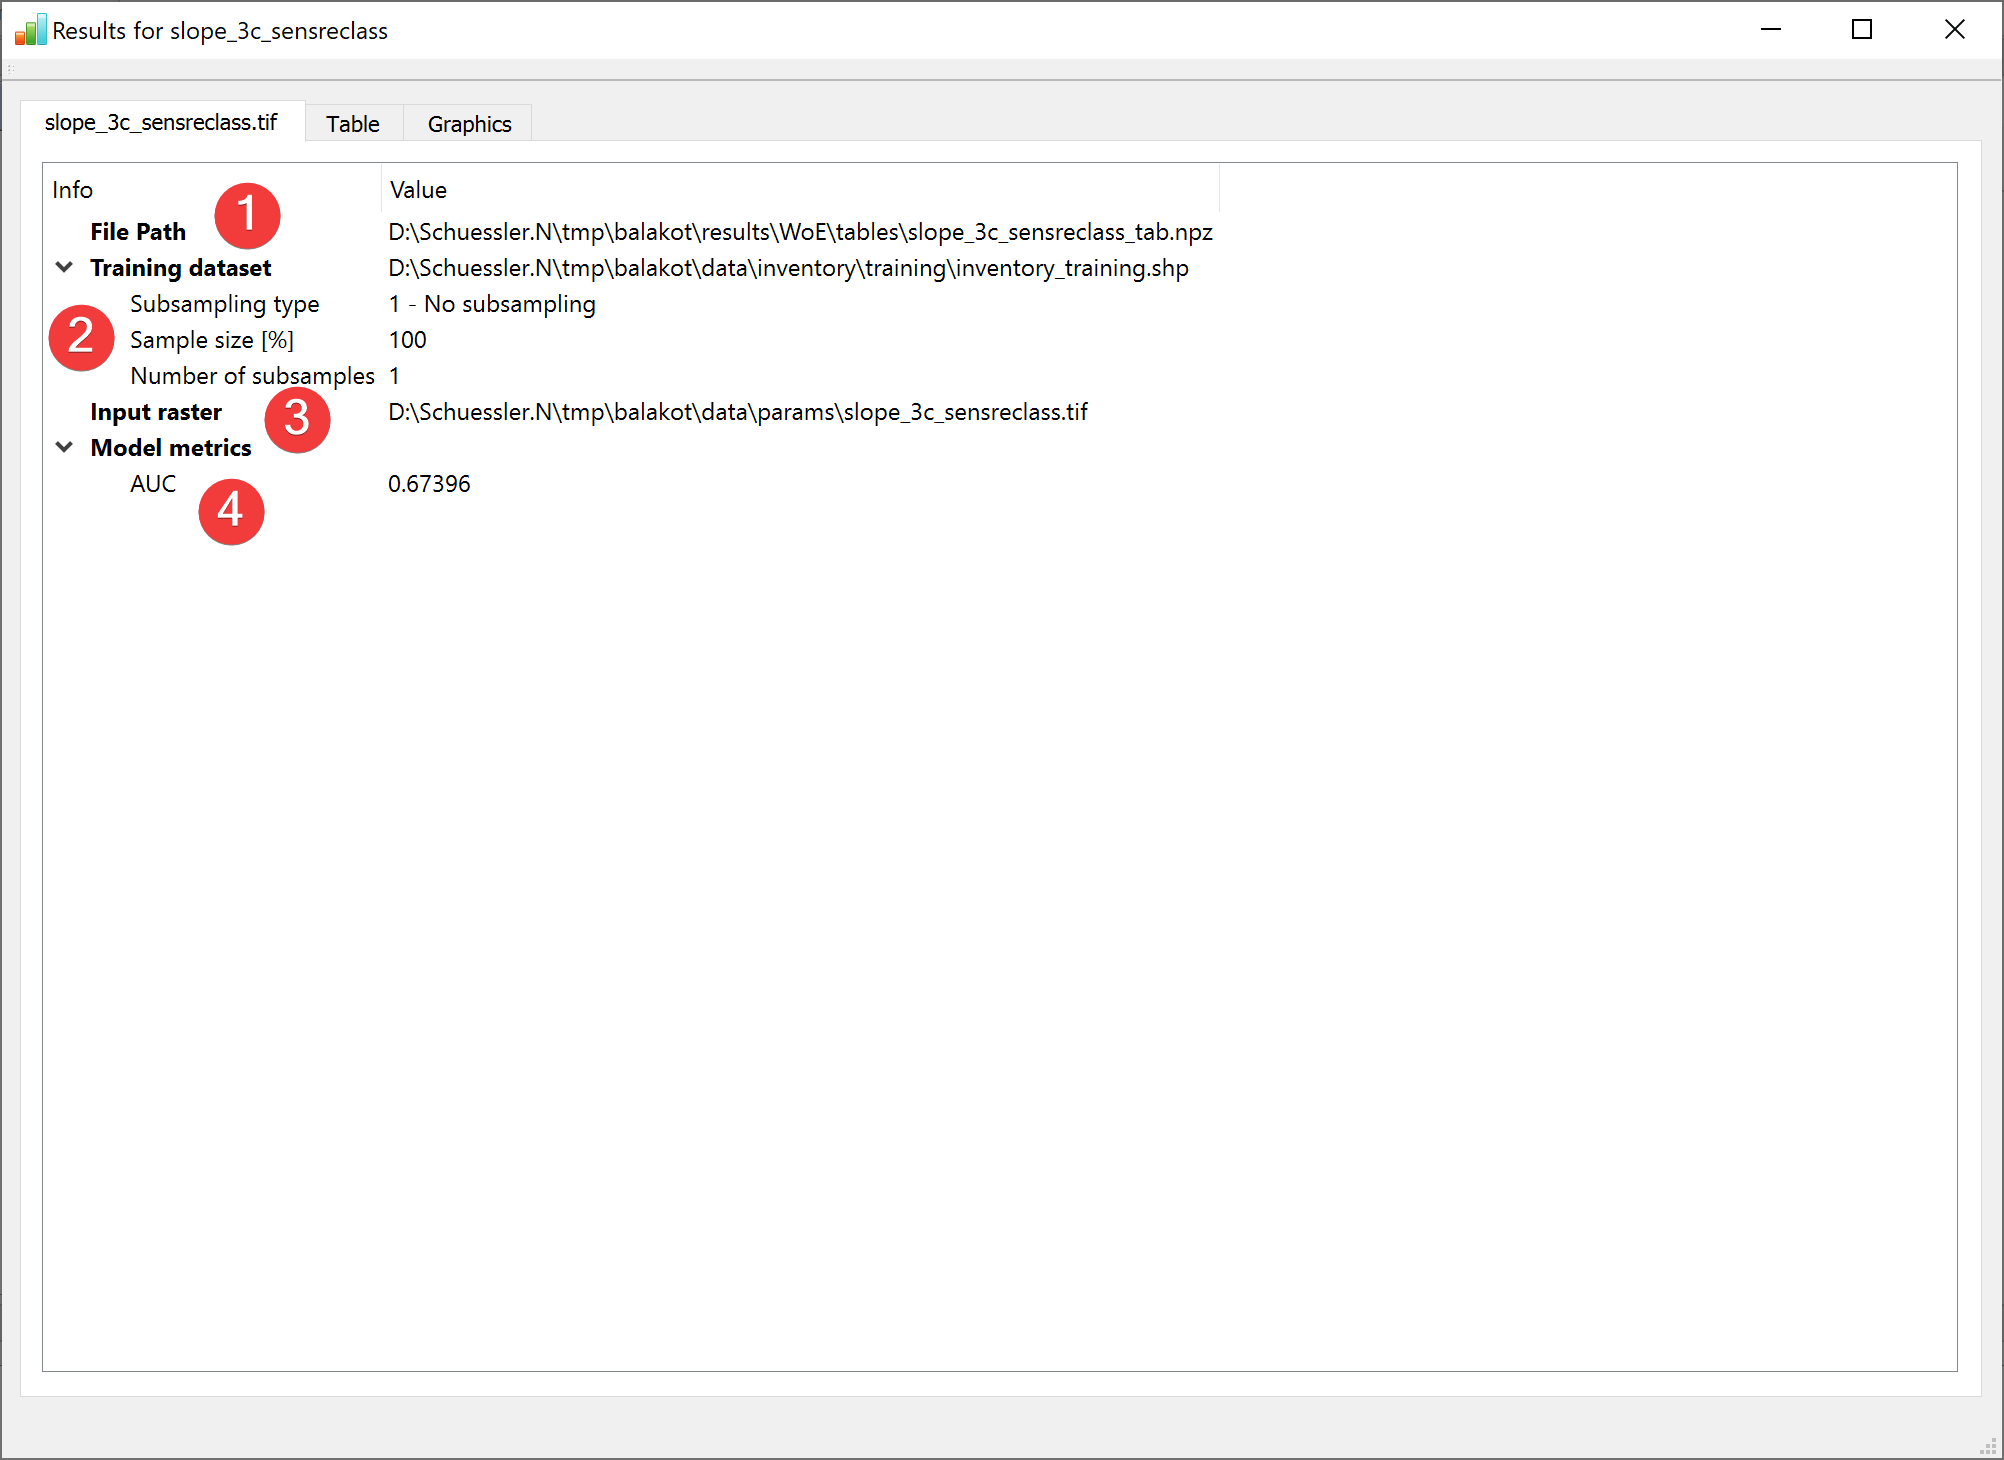
Fig. 2.29 WofE Results Widget - overview tab
Display the results of the Weight of Evidence (WofE) analysis.
2.2.12.1 Overview
(1) Shows the path to the results file.
(2) Shows the path to the used feature dataset and how it was subsampled.
(3) Shows the path to the used raster datasets.
(4) Shows basic model metrics (hover your mouse over the results to show all available digits).
The table contains all results of the calculation:
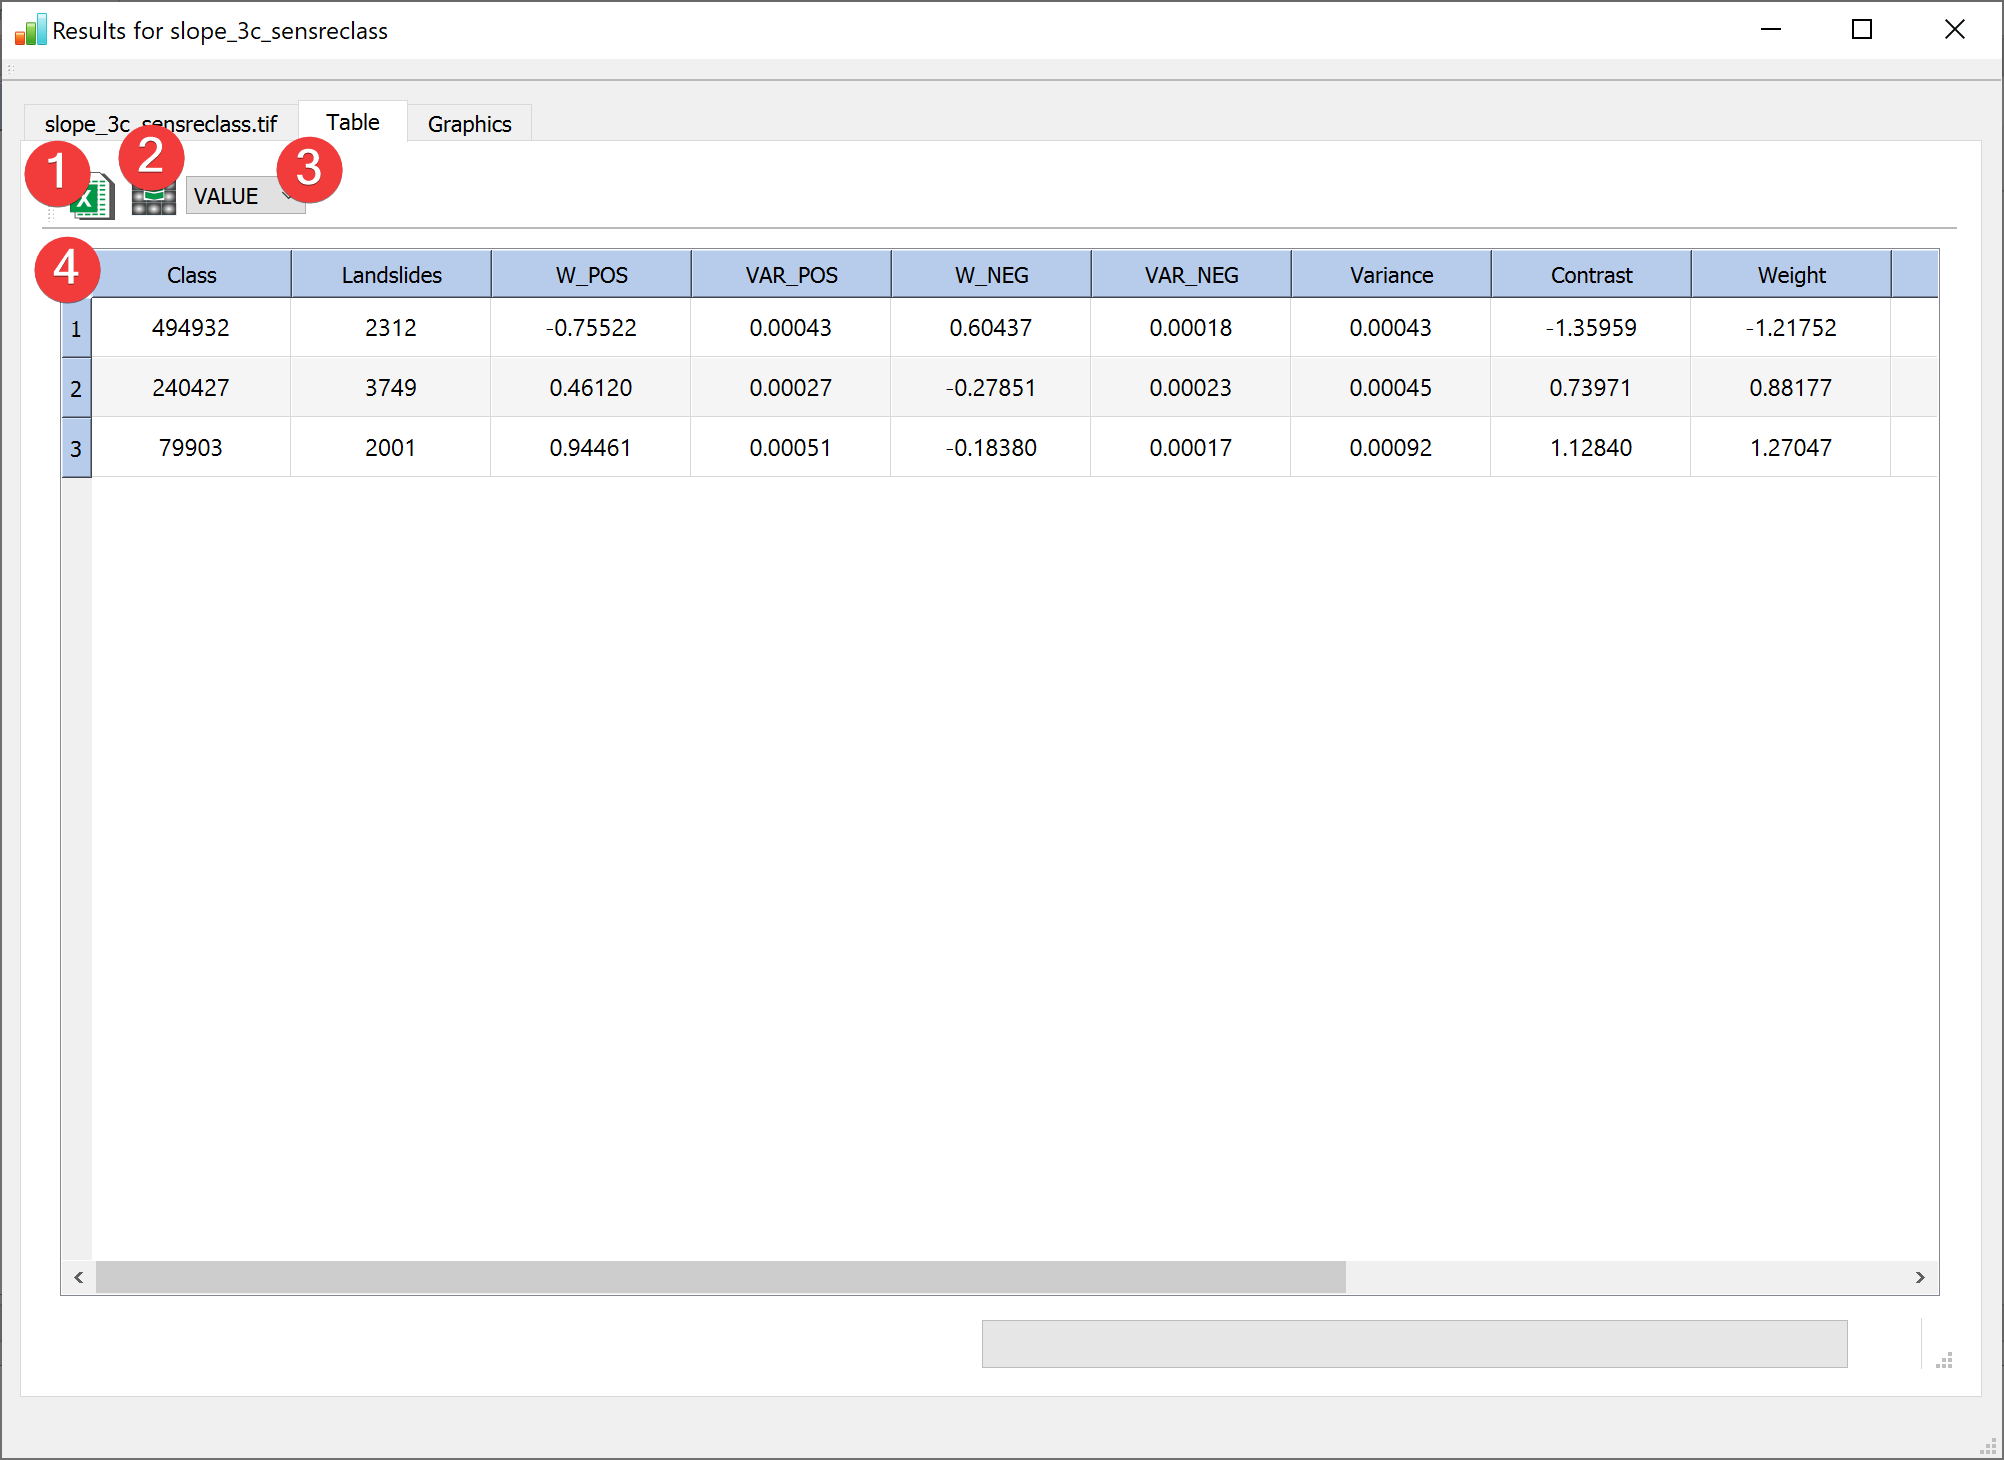
Fig. 2.30 WofE Results Widget - table tab
(1) Exports the table (4) as an excel file.
- (2) Saves a raster with the column selected in the table (4) replacing the original raster
values using a dialog.
(3) Selects an attribute from the raster attribute table to display on the far left column.
The Graphics tab shows selected results:
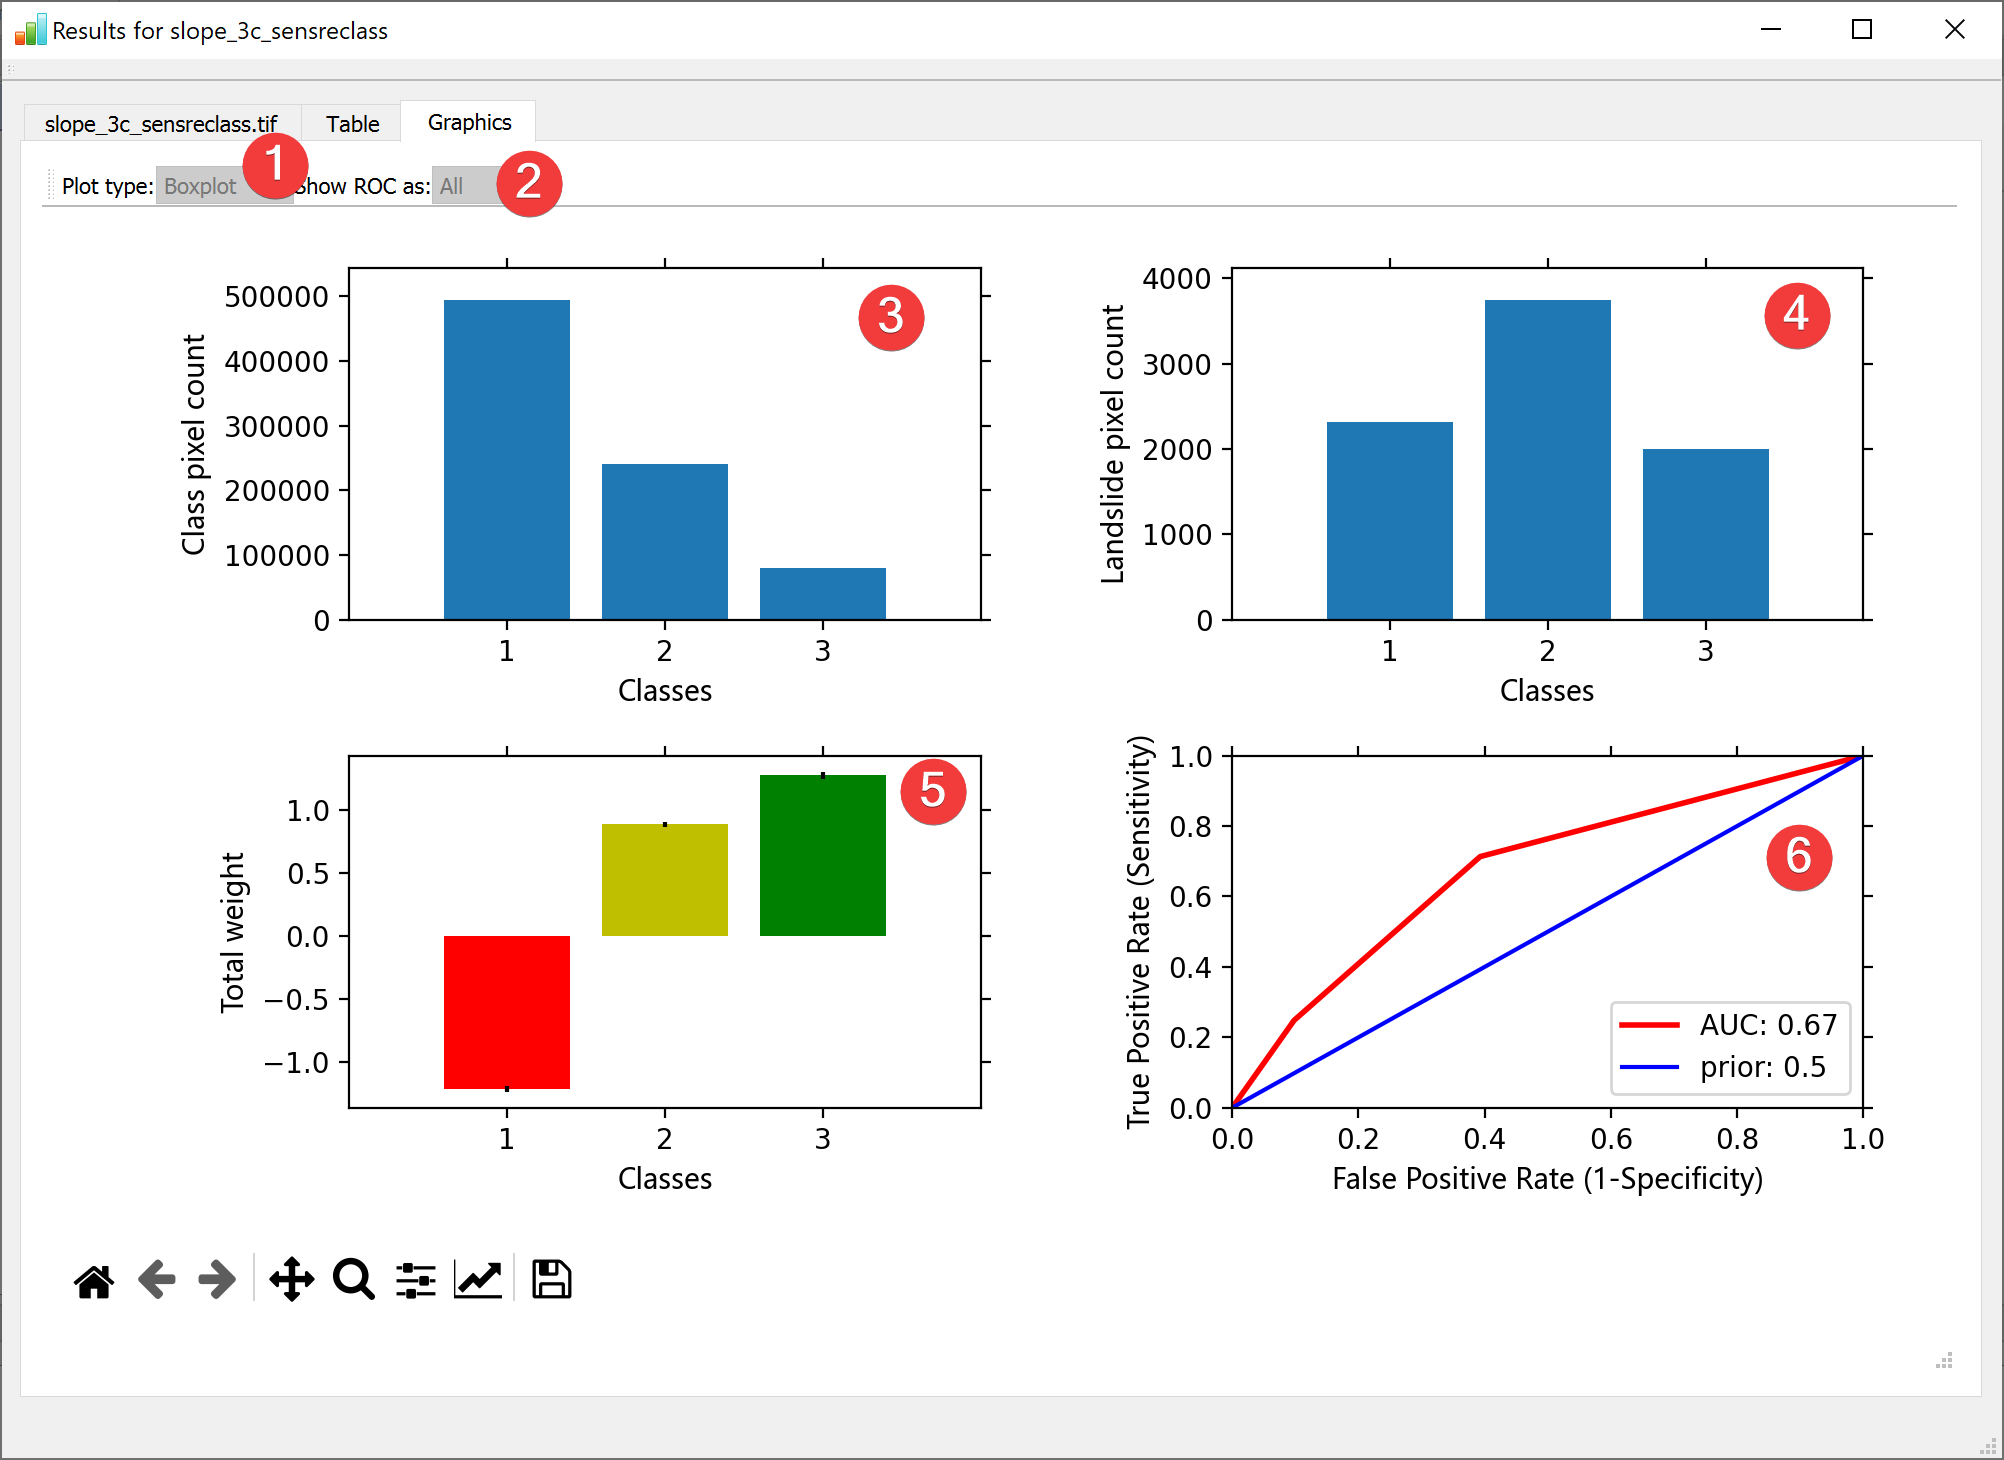
Fig. 2.31 WofE Results Widget - graphics tab
(1) Switches between Box-, and Violinplots for (4) and (5) (Only if multiple samples were used).
(2) Switches between all ROC curves or a range for (6) (Only if multiple samples were used).
(3) Shows the pixel count for each raster dataset value.
(4) Shows the landslide pixel count for each raster dataset value.
(5) Shows the total weight for each raster dataset value.
(6) Shows the ROC curve.
You can open this widget after finishing a WofE analysis or by right clicking the output .npz in the catalog.