4.2.2 Zoning
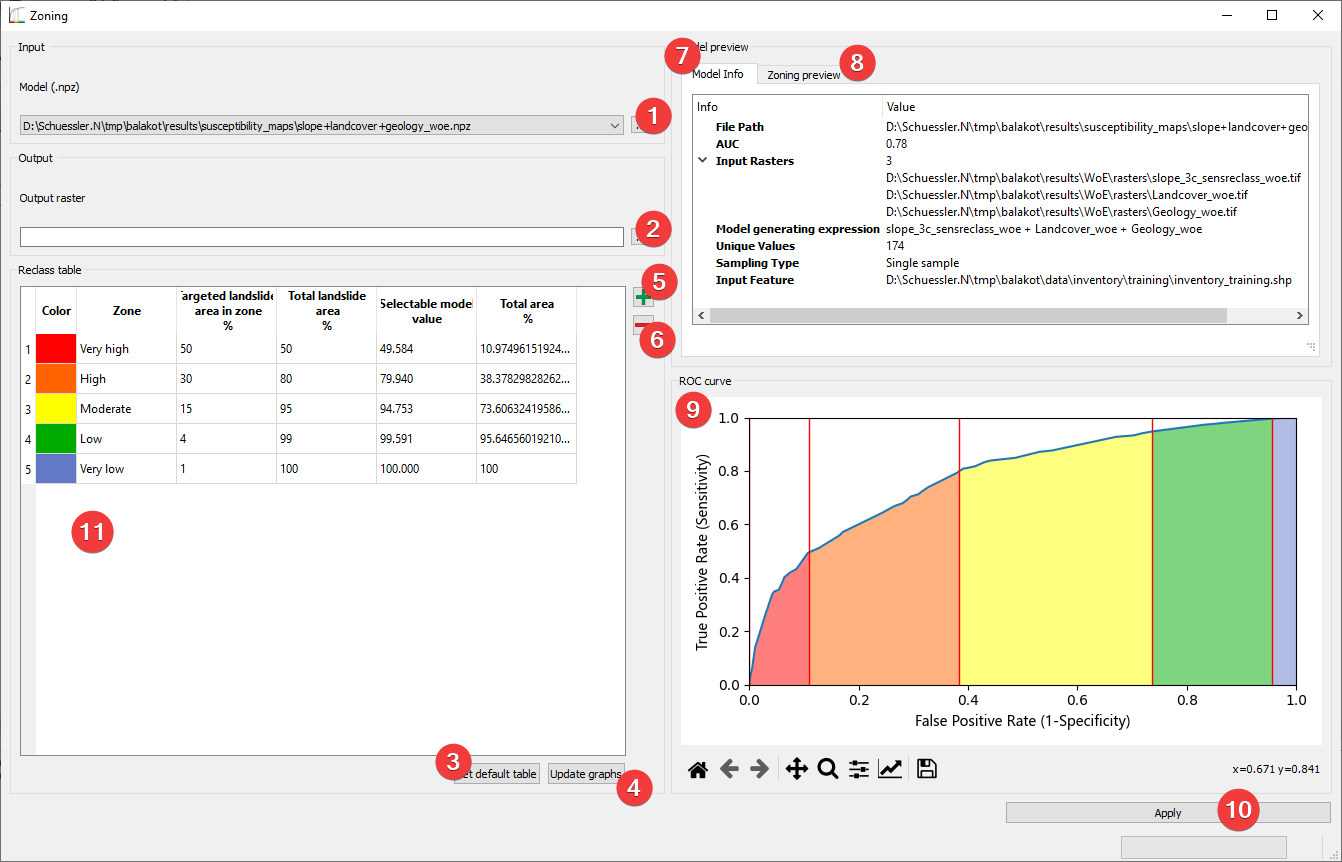
Fig. 4.13 Zoning widget
Convert your models into landslide susceptibility maps.
4.2.2.1 Usage
Pick the input model with a dialog (1)
- Pick the output map location. You can either type in the absolute file path yourselfor pick one with a dialog (2).
- Define the landslide susceptibility zones (2 Alternatives):
Set default table (3)
- Define the zone boundaries yourself:
Add (5) and delete (6) zones as needed
Name the zones in the reclass table (11)
Set the “Targeted landslide area in zone %” for each zone except the last
Update the graphs (4)
Apply (10)
The model info (7) shows an embedded version of the Model Info Widget
Zoning preview (8) and the ROC curve (9) offer a sneak peek at the resulting map.
If you started Zoning from the Model Builder Widget the selected Model will be available to you right away.
4.2.2.2 Information
The True Positive Rate (TPR) (y axis in (9)) corresponds roughly to the cumulative landslide area. The False Positive Rate (FPR) (x axis in (9)) corresponds approximately to the total area without landslides.
4.2.2.3 Input and Output
Input |
Model (.npz) |
Output |
Landslide susceptibility map (.tif) Default path: /results/susceptibility_maps/*name*.tif |